Shopify Web App
A product that empowers e-commerce owners to manage sales growth channels and marketing for their brands.

Overview
Presented Data in a Way that Helps E-commerce Owners Gain Insights and Drive Business Growth.
The Sirge Shopify app helps users track their ads and campaigns, streamlining and enhancing their marketing efforts.
It identifies sales-driving channels and offers various tools to support revenue growth.
Gamification elements were applied to engage users and encourage continuous learning in business management.
My Role
Product Designer
Worked in Agile mode with a cross-functional team to quickly deliver solutions.
Utilized tools like Mixpanel, UserLyric, and PostHog to identify user pain points and optimize the product experience.
Led design system iterations focusing on scalability and supporting fast-paced development cycles.
Tools
Figma/ Click up/ MixPanel / Figjam / PostHog / User Lyric
Team
Product Managers x 2, Product Designer x 2 (Me), Engineer x 16
Duration
Oct 2024 - Apr 2025 (Ongoing)
Presented Data Lack on Engagement

Applied micro interaction & animation to highlight data
By using micro-interactions and animations, I made the data feel less intimidating—turning it into “happy data” that empowers users and gives them a sense of control.

Less is more - Prioritized what help users make decision
Users care most about sales—they see it as the key performance metric. While metrics like “pay-per-click” are useful, they take longer to interpret. I prioritized decision-driving data.

Behavioural reinforcement - Educating user
Ads drive sales, connecting an ad account is essential for delivering valuable insights. That’s why I focused on educating users about its importance and guided them through the setup process.


Happy Data, Empathizes Data
Clear and Strategic Pathway to Capture User Behaviors and Identify Problems
There’s no such thing as a perfect design or solution. With multiple channels and platforms, I determined design direction, measure success rates, and identified problems by continuously monitoring user data.

How might We Deliver Helpful Data to the Users?

30%
of users view the home page less than 1 mins.
Problems:
I often see dashboards where 100% of sales are attributed to the “Other” channel, which indicates we were not providing meaningful or categorized data.
The dashboard mainly contains sales widgets, offering limited information overall.
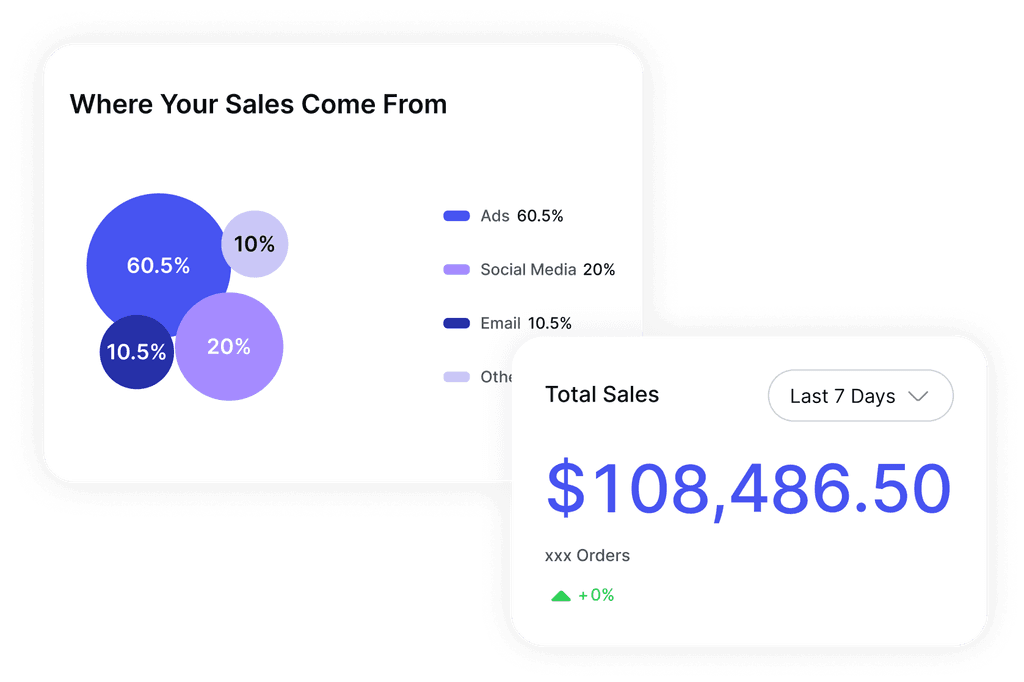
Break Down Sales by Channels Clearly
Further categorized sales into defined channels (organic traffic, direct & ) to reduce reliance on the “Other” bucket and provide users with meaningful insights at a glance.

Implementing Gamification
The "Growth Hub" feature we delivered was designed to encourage users to continuously learn and grow their business. I implemented gamification by introducing achievement levels for users to progress through.


Design with strategic intent
Design doesn’t end with completing a task. While many features begin as assigned tickets, I think a few steps ahead—asking how we can gather data to inform future decisions, and how it connects to product marketing and business goals.

Go-to-market means a lots to a product
A product can’t succeed without a clear path to attracting users. While product marketing may not be our primary role as designers, it’s still important to think beyond the screen. By collaborating with PMs and product marketers, we help spark user interest, support feature adoption, and ensure the product reaches the people it’s built for.